Tools for Calculating Adverse Impact
This section of the website provides a simple tool for calculating adverse impact. This tool is simple, represents one analysis, and does not compute all relevant adverse impact measures or evaluate the quality and accuracy of underlying data. In fact, in most situations more sophisticated analyses are necessary than what can be performed here. In those scenarios we suggest that users contact their legal advisors and/or an expert in the area of EEO/analytics.
The tool is structured as a 2 by 2 table, such that the user inputs the appropriate numbers in each cell. The rows represent the 2 EEO groups being compared, and for ease of use sex is used as the example title. Users can enter data in for any comparison of interest (e.g., White versus Black, Old versus Young, etc.) and should note which group is favored and disfavored. The tool computes the following:
- Descriptive statistics including overall and group specific selection rates
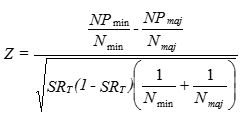
- The two-sample Z statistical significance test (also called the “2 Standard Deviation test” in practice) and a color code
for whether the result is statistically significant using a two-tailed alpha level of .05. - The absolute difference between group selection rates (as a measure of practical significance)
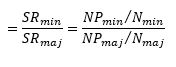
- The adverse impact ratio and a color code as to whether the 4/5th rule is violated or not (as a measure of practical significance)
From an interpretation perspective, a few points are worth noting. First, sample size affects the usefulness of all measures of adverse impact and confidence in results. As an example, very small samples may violate assumptions of the Z test, and as such we recommend that results are interpreted with caution when overall sample size is generally small (e.g., less than 30) and any one cell size is small (e.g., observed and expected values are 5 or fewer in a cell). In these scenarios other statistical significance tests may be more appropriate, and we suggest that users contact an expert in EEO analytics. Small samples render all measures limited in usefulness.
In terms of combining information, a holistic approach would typically start with the significance test as the initial consideration, since the first question of interest is whether results could be due to chance (i.e., sampling error). If results are statistically significant, we are confident that a difference between groups is not due to chance, and a second consideration would be whether a non-chance disparity is practically meaningful. The 4/5th rule, 1% of variance accounted for rule, and the absolute difference could all be considered. Should there be a practically meaningful difference, the last consideration would be the size of the disadvantaged group, which would be assessed via the shortfall.
Again, adverse impact analyses are often much more complex than anyone realizes, and as such users should talk to legal counsel and EEO analytics experts about these types of analyses, how to conduct them, and what legal steps should be taken for privilege purposes. We hope that this site and this tool are a useful starting point.